Tire size can be confusing. Some numbers on the sidewall are listed in millimeters while others are inches. Plus, the right size for your car, truck, or trailer can differ depending on where and how you drive.
You can see your original equipment tire size in your owner’s manual or on the placard generally located on the driver’s side door jam. This is the sizing recommended by the vehicle manufacturer.
If you’re interested in switching out your tires for a different look or performance, a good place to start is the numbers and other indicators on your existing tires’ sidewall. Next, have a tire professional help you determine a tire size range that will fit your vehicle and driving needs.
Here’s what those numbers and indicators on the sidewall indicate and how to understand them:
A: TIRE TYPE The first letter in the code tells you what class of tire it is.
P stands for passenger vehicle tire. P-class tires include cars, SUVs, crossovers, minivans and smaller pickup trucks.
LT means light truck tire, designed for vehicles that are capable of carrying heavy loads, towing trailers, or for those looking for an extra heavy duty option. These are often equipped on three-quarter or 1 ton trucks and SUVs.
ST stands for Special Trailer. These tire sizes are meant for trailers, including fifth wheels and other travel trailers, as well as boat and utility trailers.
If there’s no letter before the first number, you have a metric tire most commonly referred to as European size. It’s also measured in millimeters but may have a different load capacity than a P or LT tire.
B: TIRE WIDTH The three-digit number following the letter is the tire’s width (from side to side, looking at the tire head on) in millimeters. This may also be referred to as the section width.
C: ASPECT RATIO The forward slash separates the tire width number from the two-digit aspect ratio. The bigger the aspect ratio, the higher/taller the tire’s sidewall, or “profile” as it’s sometimes called.
The aspect ratio is indicated on the tire sidewall as a percentage. It’s the height of the sidewall measured from wheel rim to top of the tread, expressed as a percentage of tire width.
In this example, the aspect ratio is 65, meaning the sidewall is 65 percent as high as the tire is wide. To get the sidewall height, take the tire width of 215 mm and convert it to inches (8.46). Then multiply this by 65% (.65). This gives you an answer of 5.5, the sidewall height in inches.
D: CONSTRUCTION TYPE This single letter tells you about the internal construction of the tire.
R is for radial tires, the industry standard for most tires today. They have better road grip, lower rolling resistance for better gas mileage, ride comfort and durability than previous generations of tires. In a radial tire, the plies — layers of strong cords made of a blend of polyester, steel and fabric and coated with rubber — are laid perpendicular to the direction of travel.
D is for tires built with diagonal (crisscrossed) plies, called bias-constructed tires. They are also called conventional, x-ply, or cross-ply tires. Some motorcycle and trailer tires still use this internal construction.
Some run-flat tires are identified with an F followed by the type of internal construction.
E: WHEEL DIAMETER This two-digit number specifies wheel diameter in inches. It’s the distance between the two bead seat areas (where a tire gets tightly sealed onto the wheel).
F: LOAD INDEX The two-digit or three-digit number that follows the gap specifies tire load index. The load index symbol indicates how much weight a tire can support, based on the following standard chart. In our example, the load index is 89, which indicates the tire has a load capacity of 1,279 pounds, when inflated to the tire’s maximum air pressure rating.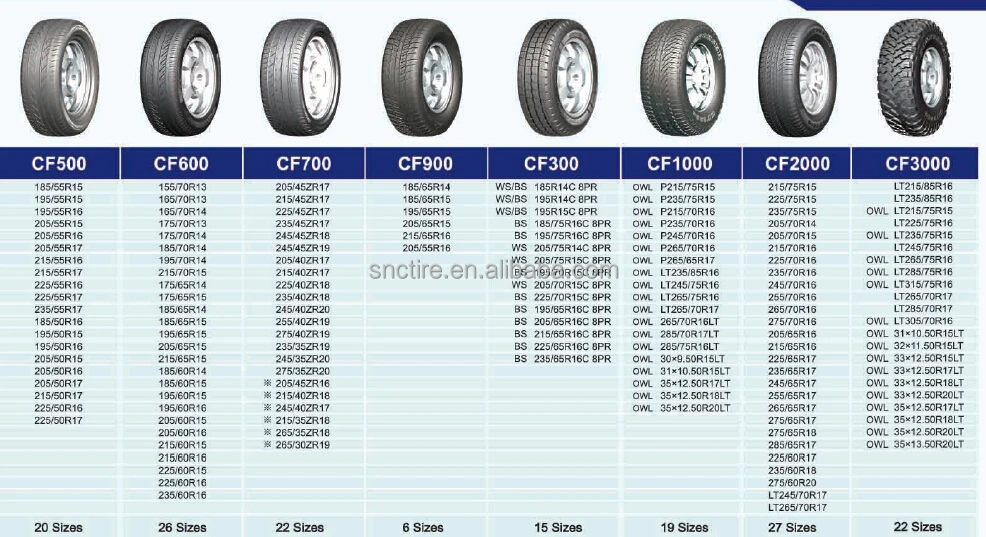
G: SPEED RATING The last letter is the tire speed rating. This indicates the top speed it’s safe to travel at for a sustained amount of time. A tire with a higher speed rating can handle heat better and provide more control at faster speeds. The maximum operating speed of a vehicle is no more than the lowest speed rating of all tires mounted on the vehicle. (Of course, you should always abide by speed limits for safer driving.) Speed rating is usually, but not always, a single letter (see the chart).
Below you will find several charts that will help you understand tire sizing numbers, including a load index chart and speed rating chart.
A tire size calculator is a quick way to see whether the tire size you’re considering will likely fit your car, SUV, sports car, light truck or crossover.
But remember that is only an estimate. It’s important to stay within the sizing tolerances of your vehicle. Tires that are the wrong size could cause some pull in the steering wheel, rub against the suspension or body of your vehicle, reduce clearance on hills, or result in a stiffer or noisier ride.
If you’re considering mounting a different tire size on your vehicle, check with a tire expert. Find out whether the tires and wheels you have your eye on are the right fit for your vehicle’s suspension, gearing, and bodywork. And ask how any differences in revolutions per mile, tire speed, load index, and speed rating will affect your ride quality and vehicle performance.
See how new tires and rims will look on your car or truck using our Virtual Wheels simulator, available at any Les Schwab.
Find Your Store
Trying to make sense of the jumble of numbers and letters on a tire sidewall? We'll explain!
Each of your tires has useful information molded right into its sidewall. You'll find the tire's brand, size, construction details, maximum load and inflation pressure, as well as traction, treadwear and temperature grades. The trick is knowing where to look. The diagram below will help you make sense of your tire's sidewall:
The tire sidewall shown above is an example of a popular "P-metric," speed-rated tire. "P" indicates that it's a passenger tire; 215 represents the width of the tire in millimeters; "65" is the height to width ratio; "R" indicates radial construction; "15" is the rim diameter code; and "95H" is the optional service description that consists of the load index (95) and the "H" speed rating. "Temperature A" reflects the temperature grade.
Some older speed-rated tires may include the speed symbol immediately before the "R" instead of providing a service description. A "B" in place of the "R" would indicate diagonal bias construction. "M+S" with the mountain/snowflake symbol indicates that the tire meets the RMA (Rubber Manufacturers Association) specifications for use in severe snow conditions.
The maximum load recommendation is shown in kg (kilograms) and in lbs (pounds), and the maximum air pressure is shown in kPa (kilopascals) and PSI (pounds per square inch). Safety Note: These are the maximum air pressure levels, not the recommended pressure for the tire when mounted on rims for your vehicle. The vehicle manufacturer's pressure recommendations (found on a decal on the doorjamb or in the glove compartment) must always be used when inflating your tires.
The "DOT" letters indicate manufacturing compliance with all applicable safety standards established by the U.S. Department of Transportation (DOT). Next to the DOT letters is an alpha/numeric serial number, commonly referred to as the DOT Code, with up to 12 digits. This code provides manufacturer detail and the last 5 numbers indicate the week and year that the tire was made. For example, "1501" indicates that the tire was manufactured during the 15th week of year 2001. This information is critical should there ever be evidence of a manufacturing problem and a tire recall. We encourage you to register your tires so that manufacturers can contact you in the case of a recall.
There are other codes on some tires that provide you with additional information, some of which are specific to light truck tire applications. Some of the other codes that you might find on your tires include:
You can enhance a chart by inserting an image (such as a company logo) into the chart area. In addition, you can use a picture fill to draw attention to specific chart elements such as the chart area, plot area, data markers (in r column, line, region, bubble, 3D, and legend area charts (in 2D and 3D diagrams) or 3D walls and ceiling diagrams.0003
You can also copy a picture to a chart or to chart elements such as data markers in 3-D charts, scatter charts, or blank charts. If the drawing is no longer needed, you can delete it.
Click in the chart area.
On the tab Insert , in the group Illustrations , click the button Pictures.
Find the picture you want to insert and double-click it.
Tip: To add multiple pictures, hold down the CTRL button and then click the 9 button0015 Insert .
To resize a picture, drag its resizing handle from the center of the picture or towards the center of the picture. To do this, you can do the following:
To keep the center of the picture in the same place, CTRL-drag it.
To maintain the proportions of the picture, drag it while holding shift.
Hold down CTRL+SHIFT while dragging to keep the center of the picture in one place and maintain its proportions.
You can also select a pattern and enter the desired size in the Shape Height and Shape Width fields (tab Format, Size group).
To move a picture, drag it to the desired location.
Note: Pictures inserted in a chart are embedded in the chart and therefore increase the file size. To reduce the file size, you can add a link to the picture instead of pasting it. AT Insert Picture dialog box, click the picture you want to insert, click the arrow next to the Insert and button, select Link to file .
Top of page
In a chart, click the chart area, plot area, data marker, legend, 3D wall, or 3D floor that you want to fill with a pattern.
The Chart Tools panel opens with additional tabs Design , Layout and Format .
On the Format tab in group Shape styles click the Fill shape button.
Click Image .
Find the picture you want to insert and double-click it.
Top of page
Select the picture you want to copy and press CTRL+C.
Click to select the chart area or chart element where you want to paste the picture into it.
Press CTRL+V to inspect the selection.
Top of page
Do one of the following:
To delete a picture inserted in a chart, click it and press the DELETE button.
To delete a picture that has been filled with a chart element, select it and do the following:
On tab Format in group Current fragment press the button Selected fragment format .
On the Fill & Line tab times, open the Fill list and select Auto.
Tip: To remove the picture and other fill effects applied to the selected chart element, select no fill .
Top of page
Click in the chart area.
Panel 9 opens0015 Working with charts with additional tabs Design , Layout and Format .
On the Layout tab, in the Insert group, click the Picture button.
Find the picture you want to insert and double-click it.
Tip: To add multiple pictures, CTRL-click them, and then click Insert .
To resize a picture, drag its resizing handle from the center of the picture or towards the center of the picture. To do this, you can do the following:
To keep the center of the picture in the same place, CTRL-drag it.
To maintain the proportions of the picture, drag it while holding shift.
Hold down CTRL+SHIFT while dragging to keep the center of the picture in one place and maintain its proportions.
You can also select a picture and enter the desired size in the Shape Height and Shape Width fields ( Format tab, Size group).
To move a picture, drag it to the desired location.
Note: Pictures inserted in a chart are embedded in the chart and therefore increase the file size. To reduce the file size, you can add a link to the picture instead of pasting it. AT Insert Picture dialog box, click the picture you want to insert, click the arrow next to the Insert and button, select Link to file .
Top of page
In a chart, click the chart area, plot area, data marker, legend, 3D wall, or 3D floor that you want to fill with a pattern.
The Chart Tools panel opens with additional tabs Design , Layout and Format .
On tab Format in group Shape Styles select item Shape Fill .
Click Image .
Find the picture you want to insert and double-click it.
Top of page
In the chart or chart, select the picture you want to copy.
On the tab Home, in the Clipboard group, click the Copy button.
Keyboard shortcuts. To copy the selection, press CTRL+C.
Click the chart area or chart element where you want to paste the picture into it.
On the tab Home in the group Clipboard click button .
Keyboard shortcuts. To modify the selection, press CTRL+V.
Top of page
Do one of the following:
To delete a picture inserted in a chart, click it and press the DELETE button.
To delete a picture that has been filled with a chart element, select it and do the following:
On the Layout tab, in the Current Fragment group, click the Format Selection button.
Click the Fill button and in the Fill area select auto.
Tip: To remove the picture and other fill effects applied to the selected chart element, select fill no .
Top of page
Excel for Microsoft 365 Word for Microsoft 365 Outlook for Microsoft 365 PowerPoint for Microsoft 365 Excel for Microsoft 365 for Mac Word for Microsoft 365 for Mac Outlook for Microsoft 365 for Mac PowerPoint for Microsoft 365 for Mac Excel 2021 Word 2021 Outlook 2021 PowerPoint 2021 Excel 2021 for Mac Word 2021 for Mac Outlook 2021 for Mac PowerPoint 2021 for Mac Excel 2019Word 2019 Outlook 2019 PowerPoint 2019 Excel 2019 for Mac Word 2019 for Mac Outlook 2019 for Mac PowerPoint 2019 for Mac Excel 2016 Word 2016 Outlook 2016 PowerPoint 2016 Excel 2016 for Mac Word 2016 for Mac Outlook 2016 for Mac PowerPoint 2016 for Mac Excel 2013 Word 2013 Outlook 2013 PowerPoint 2013 Excel 2010 Word 2010 Outlook 2010 PowerPoint 2010 More. ..Less
To make it easier to read data in an axes chart, you can display horizontal and vertical grid lines. Grid lines are extended from any of the horizontal and vertical axes of the plotting area. You can also display depth grid lines on three d charts. For major and minor units, grid lines align with major and minor axis divisions when the divisions are displayed. Gridlines cannot be displayed for charts that do not display axes, such as pie chart and donut chart.
1 Horizontal grid line
2 Vertical grid line
3 Z grid line
Note: The following procedure applies to Office 2013 and newer versions. Looking for Office 2010 steps?
Click the chart to which you want to add grid lines.
On the tab of Design, in the Chart Layouts group, click Add Chart Element , hover over Gridlines and select the option you want. Hover your mouse pointer over each gridline option to view it.
Note: The options available depend on the chart type. For example, if a 3-D chart is selected, you will see grid line options for the Z axis, and if the chart has a secondary horizontal axis, you will see grid line options for the secondary horizontal and vertical axes.
Click the chart from which you want to hide the grid lines.
On the tab of Design, in the Chart Layouts group, click Add Chart Element , hover over Gridlines and select an option. Hover your mouse pointer over each gridline option to view it.
You can also select the horizontal and vertical grid lines you want to delete and press the DELETE key.
To display chart grid lines:
Click the chart to which you want to add grid lines.
On the Layout tab , in the Axes group, click the Gridlines button.
Do one or more of the following:
To add horizontal grid lines, select Horizontal Grid Lines on Primary Axis , and then select the option you want.
To add secondary horizontal grid lines, select Grid lines on secondary horizontal axis .
Note: This option is only available for charts with a secondary horizontal axis. For more information, see Add or Remove an Extra Axis in a Chart.
To add vertical grid lines, select Primary axis vertical grid lines , and then select the option you want.
To add secondary vertical lines, select Grid lines on secondary vertical axis .
Note: This option is only available for charts with a secondary vertical axis. For more information, see Add or Remove an Extra Axis in a Chart.
To add depth gridlines to the 3-D chart, select Z Gridlines , and then select the option you want.
Note: This option is only available if the selected chart is actually a 3-D chart, such as a 3-D bar chart.
To hide chart grid lines:
Click the chart from which you want to hide the grid lines.
On the Layout tab , in the Axes group, click the Gridlines button.
Do one or more of the following:
Select Horizontal Gridlines Main Axis, Vertical Gridlines Main Axis, or Gridlines Z (for 3D chart) and value No .
Select Grid lines on minor horizontal axis or Grid lines on minor vertical axis and the value No .
Note: These options are only available if the chart has a secondary horizontal or vertical axis.
Select the horizontal and vertical grid lines you want to delete and press the DELETE key.
To make it easier to read data in a chart, you can display horizontal and vertical grid lines that are located in the chart area. You can also display depth grid lines on three d charts. Gridlines can be displayed for major and minor units, and aligned to major and minor axis divisions when they are displayed.
This step only applies to Word for Mac: in the menu View, select Print layout .
Click the diagram and open the Design tab .
Click Add chart element > Mesh .
Select the axis to which you want to apply the gridlines, or click Advanced Grid Options to open the Main Grid Lines Format area. You can change the transparency of the line, add arrows, and apply shadow, glow, and anti-aliasing.
The availability of some gridline options depends on the type of datasheet or chart.